
In earlier columns I made the case that Arizona is the Rudy of American public education. Rudy of course didn’t have the grades to get into Notre Dame (until he hit the books) and was too small to play football (until they couldn’t keep him off the field). New data from Stanford University demonstrates once again that Arizona schools are exceeding expectations.
Stanford scholar Sean F. Reardon released a treasure trove of K-12 data by school, county and district, allowing for a number of interesting visualizations. Dr. Reardon’s data allows for the tracking of academic gains over time, and now includes 2016 data. Arizona once again shows we are a high-growth state.
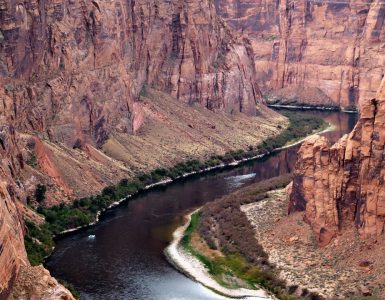
The below chart shows the combined math and reading gains for every public school in Arizona. The dark green represents high growth schools, and the dark blue represents low growth schools. Each school is sized according to enrollment (big schools = big circles).

The horizon of this chart tracks the percentage of students eligible for free or reduced lunch (0% on the far right, 100% on the far left) while the vertical axis tracks academic progress between grades 3-8 (dark green is high growth, dark blue low growth). Note that there is more green than blue, more dark green than blue, and only three dark blue (very low growth) schools compared to scores of dark green.
I’ve sampled states and here is what stands out about Arizona: first it is very green, and secondly our high growth schools are broadly distributed across the socio-economic profile of schools. Arizona has low-poverty, high growth schools, but we also have high-poverty, high growth schools. If you look at the same growth chart for the nation’s highest scoring state (Massachusetts) you’ll see a large cluster of the green schools concentrated in the low poverty area. Arizona on the other hand sees a lot of green everywhere. The two highest growth schools in Arizona— Reyes Maria Ruiz Leadership Academy and Mexicayotl Charter School—are both high poverty public charter schools.
Reardon’s data tool also allows the user to download data, including data converting district and charter state scores into National Assessment for Educational Progress (NAEP) scores during the 2009 to 2013 period. Each district includes the charter schools operating within the district boundaries, and districts vary considerably during this period regarding the percentage of students attending charters. Reardon’s district/charter combination estimates also lack the precision that a statewide estimate would have, so some random anomalies doubtlessly lurk in the data here and there. Note as well that some of this data is literally a decade old at this point, and the period covered in the chart below was very difficult for Arizona’s economy.

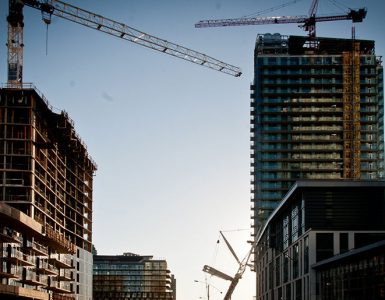
With those caveats in mind, I decided to plot Reardon’s estimated NAEP eighth grade math scores and gains (2013 eighth grade scores minus 2009 fourth grade scores) for Arizona districts and the charter schools within their boundaries, the United States, Arizona (the state with the highest gains during that time period), Alabama (the lowest performing state in the 2013 NAEP) and Massachusetts (highest performing state in the 2013 NAEP).
Lots of interesting things to unpack: the differences within states is much greater than those between states. At just over 30 points, the average Massachusetts students stood at a little under two and a half to three grade levels worth of average academic progress ahead of the average student in Alabama. That is a very large and meaningful difference. The largest difference between the highest and lowest performing Arizona jurisdictions are twice as large.
Next let’s take a moment to acknowledge Arizona school districts and charter schools within their boundaries that scored in the same neighborhood as Massachusetts. I’ve marked a few of the notable high performing/high growth district and charter combinations, and the state’s two largest districts of Mesa and Tucson.
Some of these districts are demographically advantaged compared to Arizona as a state, but far fewer of them are advantaged compared to Massachusetts or Vermont. Massachusetts and Vermont are among the small handful of states with an average family income for a family of four in six figures, and they spend a great deal more per pupil than we do in Arizona. Take Vail School District for example—they apparently didn’t get the memo that they weren’t supposed to beat the rich kids. And Vail only has district sponsored charter schools during this period, so the district gets all the credit)
Taken together there is a lot of good news in these two charts, but also unfinished work to be done. Schools on tribal nations make up most of the cluster of low performing district/charter combinations in the second chart on the bottom left.
The toolbox which has been helping to drive improvement in Arizona’s urban areas faces hurdles in rural Arizona. A majority of Maricopa County students attend schools other than their assigned district school—as open enrollment, magnet and charter opportunities are relatively plentiful. Bringing these opportunities to rural areas faces several challenges. We have however started to see some innovative and community-based school models emerging in these areas.
We have faced many challenges and we will face many more. I’m willing to bet big on a state whose educators can start their own schools and where families have the power to take the lead in deciding which is the best fit for their children.


Add comment